- The RoboLAND lab investigates the feasibility of using robots to investigate planetary bodies by developing sensing-while-moving gait patterns at Martian and Lunar analogue sites
- Objective: Create visualization tool that displays interpolated regolith strength (ground stiffness) between the footsteps of Spirit, the lab’s 12-DOF quadruped robot, as it traverses across Martian and Lunar analogue sites
- Key requirements
- Process GPS data and robot positional data to match up footsteps with regolith strength measurements
- Find interpolation process that suits the needs of both the engineering team of RoboLAND and geoscientist collaborators at NASA and peer institutions
- Display interpolated regolith strength map in an intuitive manner
- Project management approach: Weekly meetings with post-doc mentor and PI of lab
- Challenges encountered
- Limited data – more indoor trials were conducted
- Difficult situation to correctly model due to kernel (initial parameters) specifications
- Model interpolated differently with GPS data vs positional data
- Outcomes:
- Successfully built visualization that was customizable with initial parameters based on Spirit’s gait length.
- Visualization ran in real-time at NASA Ames demonstration and interpolated well against the ground truth
- Coauthor of 2025 Lunar and Planetary Science Conference (LPSC) abstract.
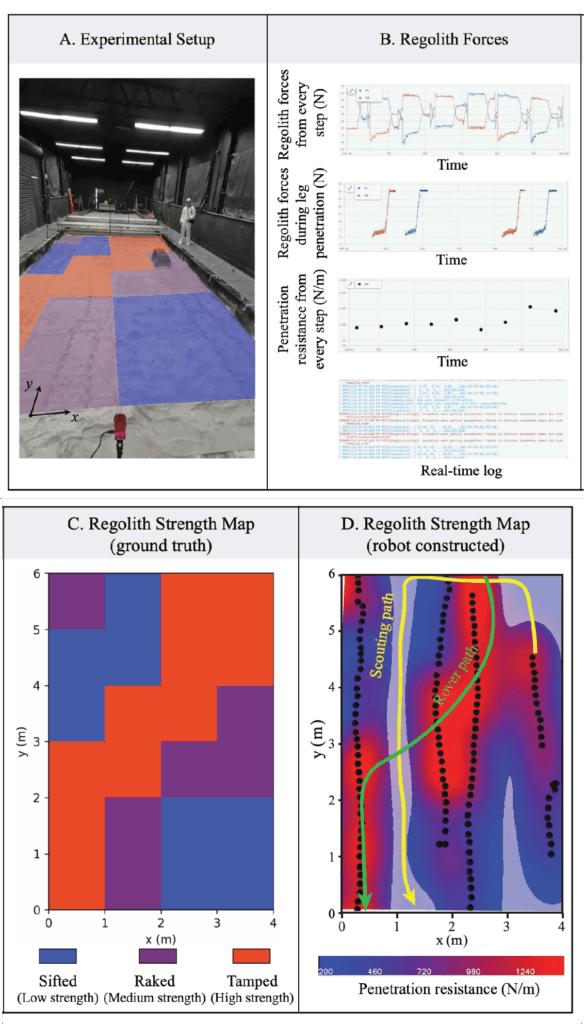
Figure description
Liu, S. et al: “Online regolith strength mapping and exploration planning. (A) Experimental setup: A legged scouting
robot proprioceptively measures ground reaction forces and estimates regolith strength as it walks across the LHS-1
testbed at NASA Ames Research Center. (B) A custom-designed GUI for visualizing robot-measured terrain forces
and regolith penetration resistance as the scouting robot makes every step. (C) Prepared regolith strength pattern in the
testbed. Red regions were tamped sand with high strength; purple regions were raked sand with medium strength, and
blue region were sifted sand with low strength. (D) Robot-reconstructed regolith strength map. Black circles represent
sampled locations by robot walking. High transparency represents large uncertainty. Yellow curve represents an
illustrated example of planned scouting robot path based on current uncertainty. Green curve represents an illustrated
example of planned safe exploration path for the rover.”